Storytelling with Data
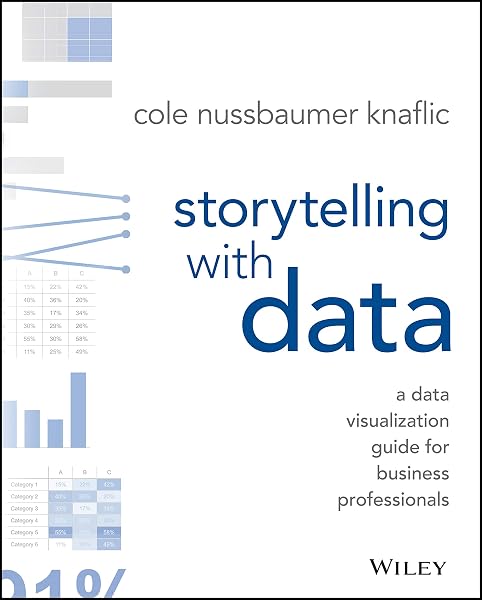
A practical guide to making charts that people actually read. Strip away the clutter, put the point in the title, and design for the one question your audience is really asking.
A chart has a job
Most business charts are generated automatically and then left alone, which is why so many of them are technically accurate and practically useless. Knaflic starts from the opposite direction: what do you want the person looking at this to conclude, and what is the shortest path to that?
That single question eliminates most design decisions. If the point is a trend, the chart must make the direction obvious in under a second. If the point is a comparison, the comparison must be the largest thing on the page.
The clutter audit
The book's most immediately useful lesson is a systematic removal of everything that is not data. Borders around the chart area. Gridlines at every interval. Axis lines that add nothing. Tick marks. Legends that repeat what direct labels could say. Data labels on every point rather than the one that matters.
The principle is that anything demanding attention without carrying information is stealing attention from the data. Every element should earn its place. Many charts improve dramatically simply by deleting half of them.
Colour as a spotlight
Knaflic's rule is that colour should mean something. If a chart is grey except for the one line you want noticed, the eye goes there without instruction. If every series is a different bright colour, the viewer has to work to find the message, and most will not bother.
Consistency across charts matters too. If blue means actuals in one place, blue cannot mean forecast in the next. An inconsistent palette makes an audience distrust the whole presentation.
The title is the message
A descriptive title tells you what the chart is about. An assertive title tells you what it means. "Revenue by region" is descriptive. "Revenue declined in three of four regions" is assertive, and it is what a reader actually needs.
This is the single highest-return change in the book. It takes thirty seconds and it transforms how a chart is read, because it tells the viewer what to look for instead of leaving them to guess.
Choosing the form
Knaflic works through the standard set: line for trend over time, bar for comparison across categories, scatter for relationship between two variables, and the cases where a table or a single number is the honest answer.
The rule she keeps returning to is that the decision is driven by the question, not by the tool's default. Software will happily produce a pie chart with eleven slices. Deciding that it should be a sorted bar chart is the analyst's job, not the software's.
Presenting, not just drawing
The final sections cover delivery: how to build a narrative around the charts, when to show one chart instead of ten, and how to handle a room that wants to argue with the data rather than decide.
The advice on slide count is refreshingly blunt. If you cannot make your point in two or three charts, you probably have not decided what your point is yet.
The bottom line
Data visualisation is communication, not decoration. Decide the message, strip everything that does not serve it, and point at the conclusion with colour and words. The techniques are simple enough to apply to your next chart this week.
🔑 Key actionable ideas
- The purpose of a chart is not to show data, it is to make a point. Decide the point before you decide the shape.
- Most charts carry decoration that competes with the data: gridlines, borders, redundant labels, three-dimensional effects. Remove all of it.
- Use colour sparingly and consistently. If everything is highlighted, nothing is. Grey is the most useful colour on a chart.
- Put the conclusion in the title. "Costs rose 14 percent in the last quarter" beats "Quarterly costs" every time.
- Choose the chart form last. The question usually rules out most forms before you get to aesthetics.
Who is this book for?
Anyone who makes charts for other people — analysts, managers, students — and readers who want their data to persuade rather than merely appear.
Final verdict
A genuinely practical design book that improves your work the day you read it. It is more craft than theory, and the examples are business-specific, but the principles transfer to any chart anywhere.